


You suspect a third-party analytics script is slowing your page down. You can't be sure without removing it, and editing the source, deploying, and testing just to check a theory is slow, and risky if you're wrong.
AB Testing lets you try the change first. Apply a suggested fix, run the test, and Niteco Performance Insights compares the modified version against the original so you know the impact before you touch a line of real code. For teams running the same fix across several storefronts or regional domains, that's the difference between rolling out a guess everywhere and rolling out something you've already measured.
Why editing the source to test a theory is a bad first move
If you want to know whether lazy-loading images will help, or whether a specific script is worth the load time it costs, the direct way is also the slowest one: make the change, deploy it, wait for a test to run, then decide if it worked. If it didn't, you've shipped a change for nothing and now you're rolling it back.
A controlled comparison answers the question without the risk
AB Testing runs two versions of the same page, one unchanged and one with your proposed fix applied, and puts the results side by side. You get the answer without a deploy, and without anything reaching production until you've decided it's worth it.
How AB Testing works in Niteco Performance Insights
Open the AB Testing tab from any page report and your selected test is analyzed for opportunities automatically.
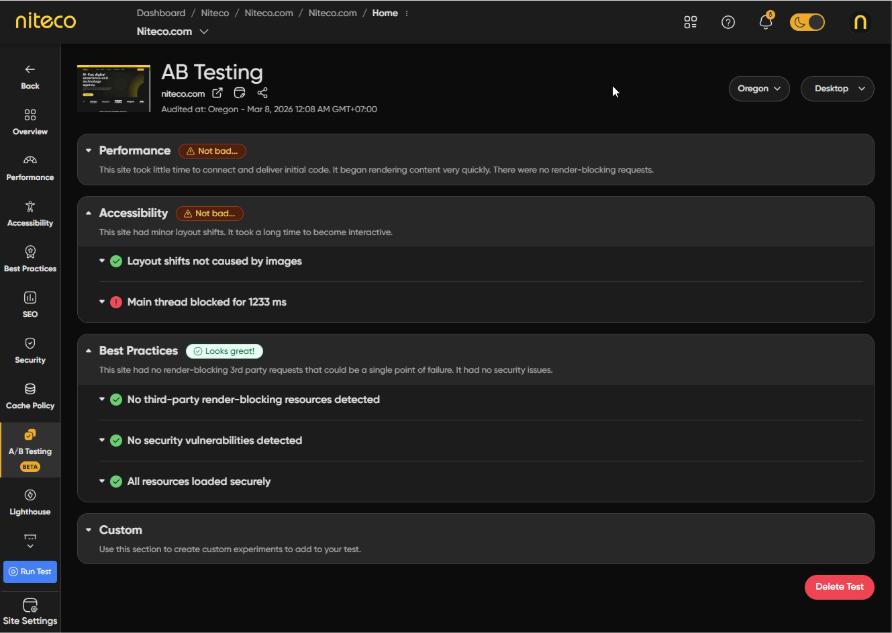 The AB Testing tab, with suggestions grouped by Performance, Accessibility, Best Practices, and Custom.
Suggestions are grouped and graded
Niteco Performance Insights generates a list of suggested optimizations grouped into Performance, Accessibility, Best Practices, and Custom, each with a grade and a set of issues you can expand. A Performance category might flag render-blocking CSS files, images that could be lazy-loaded, or files served without compression, each as its own line item.
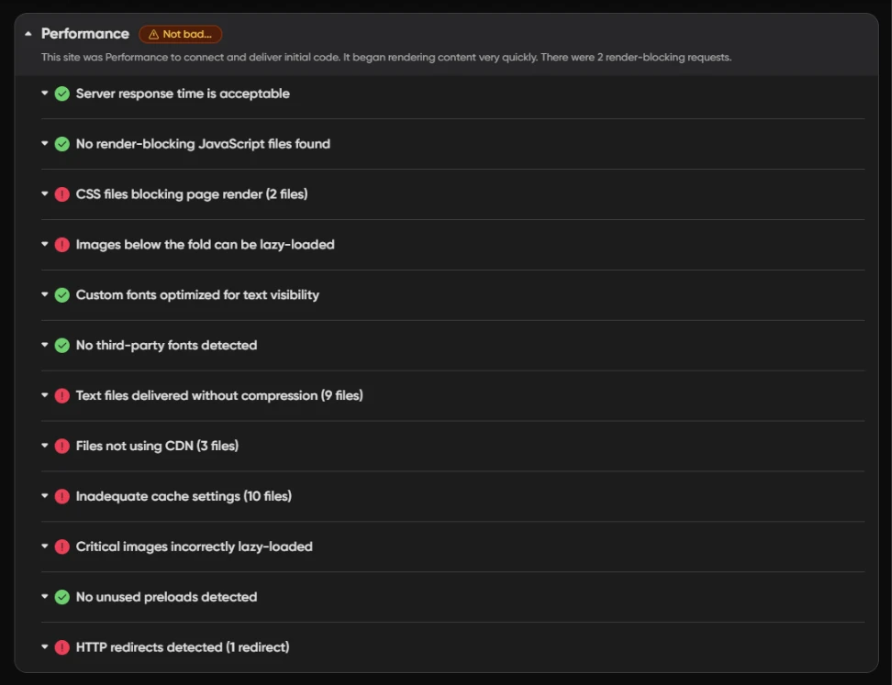
Individual issues under the Performance category, each expandable.
Running the test queues a control and an experiment
Pick the changes you want to try, and when you run the test, two tests are queued: a control test with the page unchanged, and an experiment test with your suggestions applied. Both run under the same conditions, so the only variable is the change itself.
Suggestions worth trying first
The suggestions come from analyzing your actual page, not a generic checklist, so what shows up will vary. A few common ones:
- Lazy load images below the fold, so the browser only loads them as the user scrolls to them.
- Defer or async scripts so they stop blocking the main thread while the page renders.
- Self-host fonts or add preconnect hints to cut the overhead of loading them from external domains.
- Block a specific script, like an analytics or ad tag, to measure exactly what that one script costs you.
Isolating third-party impact entirely
The Custom category includes an experiment that blocks every third-party request at once. It runs your page with all external scripts and resources removed, so you can see how it performs without any of them.
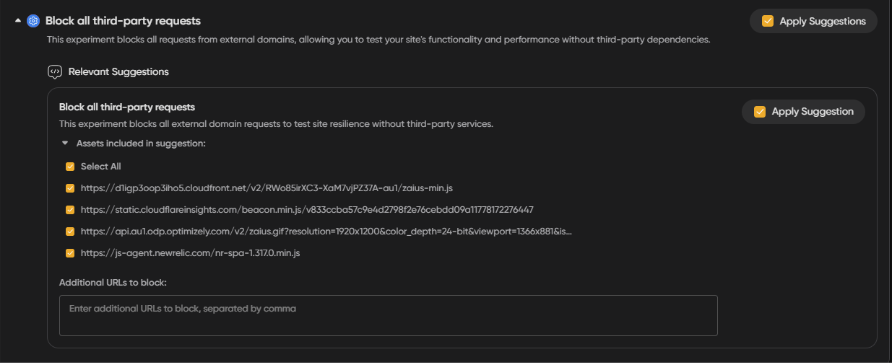
The Block all third-party requests experiment, with individual assets selected.
If the page comes back much faster with everything blocked, third-party code is a significant part of your load time, and you know where to start narrowing down which script is responsible. If it barely moves, you can stop treating third-party scripts as the suspect and look elsewhere.
Note: Blocking all third-party requests will also disable anything those scripts do, tracking, chat widgets, personalization. It's a diagnostic test, not something to run on live traffic.
Reading the results
When the two tests finish, a compare session opens automatically with both results side by side. Lighthouse scores, Web Vitals, and other metrics from the control and the experiment sit next to each other, so the effect of your change is direct to read, not something you have to infer.
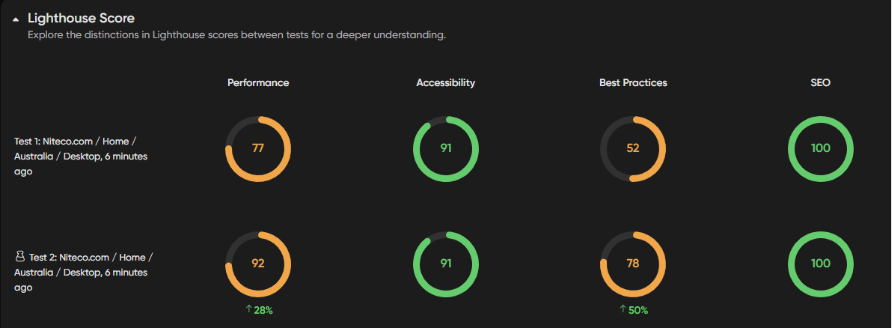
Control versus experiment: Performance moved from 77 to 92, Best Practices from 52 to 78.
In this example, the experiment's Performance score moved from 77 to 92 and Best Practices moved from 52 to 78, while Accessibility and SEO stayed flat because nothing in the experiment touched them. That's the kind of result that tells you whether to implement the change in your source code, or drop it and look at the next suggestion instead.
What AB Testing won't tell you
AB Testing is currently a beta feature in Niteco Performance Insights, so expect it to keep changing as more suggestion types are added. Treat results as a strong signal, not a guarantee that production will behave identically, especially for changes that interact with things outside the test itself, like a CDN configuration or a caching layer.
It also tests synthetic runs, not real visitors, so it won't tell you how an actual audience responds to a change, whether removing a personalization script affects conversion, for instance. That's a business question, and AB Testing only answers the technical one: did this change make the page faster or slower. Pair a promising result with real monitoring after you ship it, rather than treating the test result as the final word.
When this is worth reaching for
AB Testing is most useful in a few recurring situations for teams managing more than one site:
- Before rolling a fix out across every regional storefront, test it on one first and confirm it actually helps.
- When a script's value is being debated internally, block it and measure the real cost instead of arguing from assumptions.
- When a Lighthouse audit flags several issues at once and you want to know which one is worth fixing first.
Summary
Testing a fix before you ship it turns "we think this will help" into a number you can act on. Next time you're weighing whether a script, an image strategy, or a font choice is worth its cost, run it through AB Testing instead of guessing.
Don't have an account yet? Start a free trial of Niteco Performance Insights or read the AB Testing documentation to get started.