


Your homepage scored 90 on Lighthouse last week. This morning it's 74. Nothing in the deploy log looks obviously wrong, so now you're switching between two open tabs, trying to hold last week's numbers in your head while reading this week's.
Comparing two performance tests side by side solves that problem directly. Put the before and after next to each other and the numbers point to the cause instead of you guessing from memory. That matters more once you're managing several storefronts or country domains, where a regression in one region can sit unnoticed for days if nobody's looking at it directly.
Why a single report doesn't tell you enough
A Lighthouse score is a summary, not a diagnosis. A drop from 90 to 74 tells you something changed. It doesn't tell you what.
The usual workaround is slow
Most teams handle this by opening two reports in separate tabs and switching back and forth, checking Time to First Byte, then First Contentful Paint, then Largest Contentful Paint, then Time to Interactive, one at a time. It's manageable for a single metric. It breaks down once you're doing this across desktop and mobile, or across five regional versions of the same page.
Putting both tests in one view removes the guesswork
A compare session shows both test runs on the same screen, metric by metric, so you can trace a score change back to whatever actually moved, rather than reconstructing it from two browser tabs.
How to compare two tests in Niteco Performance Insights
The Compare Tests feature in Niteco Performance Insights puts two test results into one report, with every metric lined up side by side.
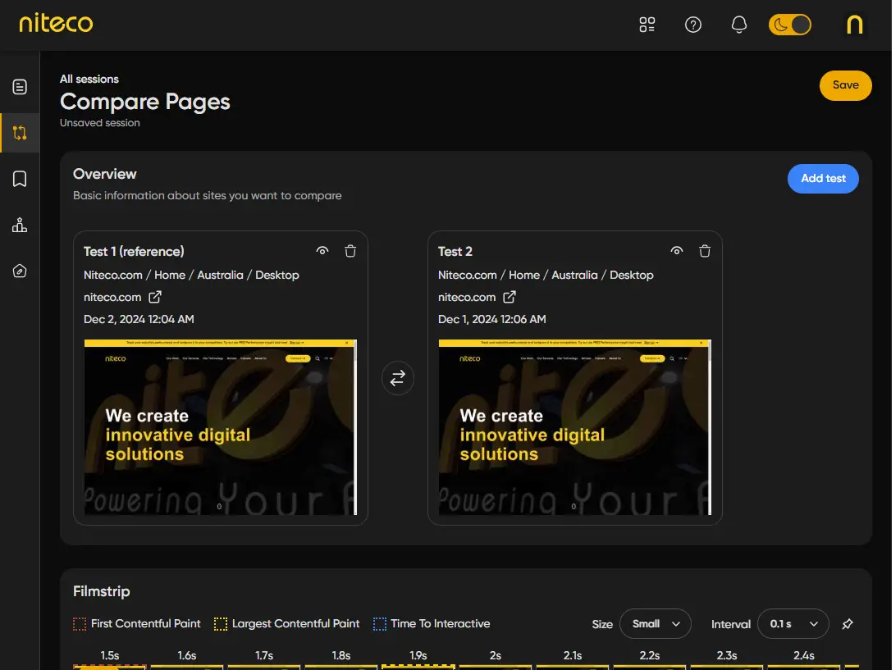
The Compare Pages overview: two tests loaded and ready to compare.
Running a comparison takes two clicks
Click any point on a chart, select Compare Test, then click a second point. The report loads both results and lines them up automatically. No exporting data, no separate spreadsheet.
What shows up in the comparison
The Web Vitals panel puts your core loading metrics next to each other, test to test:
|
Metric |
Test 1 |
Test 2 |
Change |
|
Time to First Byte |
1.18s |
1.07s |
↓ 9.4% |
|
First Contentful Paint |
2.2s |
2.1s |
↓ 4.5% |
|
Largest Contentful Paint |
2.2s |
2.21s |
↑ 0.5% |
|
Time to Interactive |
3.44s |
3.32s |
↓ 3.5% |
(Example comparison shown in Niteco Performance Insights.)
Below that, the Network Requests panel breaks down what loaded during each test by asset type, HTML, CSS, JS, fonts, images, and third-party scripts, showing request count, duration, and total size for each. If a new third-party script pushed up load time, or an unoptimized image inflated page weight, this is usually where it shows up.
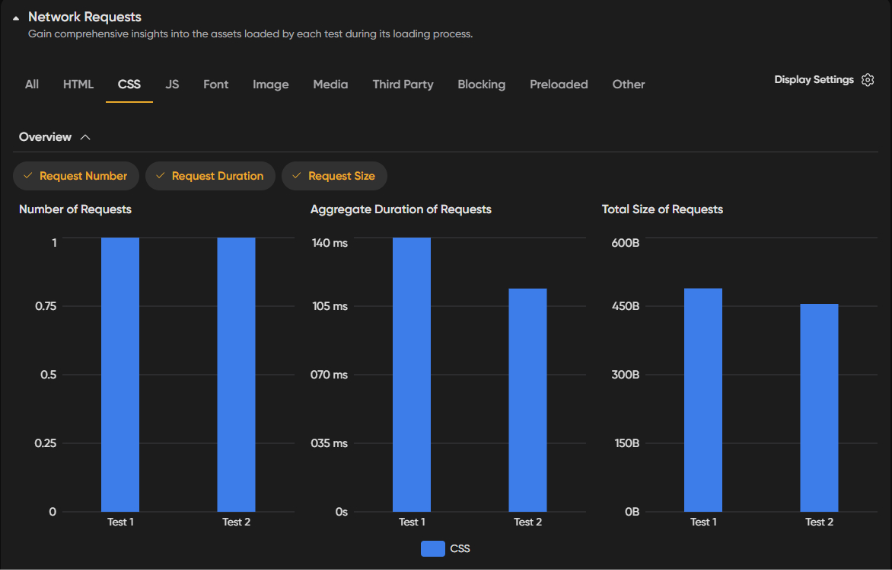
Network Requests filtered to CSS, comparing request count, duration, and size between two tests.
Tip: Filter Network Requests down to one asset type at a time (CSS, JS, images) when you're chasing a specific regression. Comparing everything at once buries the signal in noise.
Four situations where a compare session earns its keep
- Confirming a fix worked. Ship the change, run a new test, compare it against the baseline. If the score moved and the regression is gone, you've got proof, something concrete for a release note or a client update.
- Catching regressions before launch. Compare a staging build against production before you deploy, so a regression gets caught before it reaches shoppers instead of after.
- Benchmarking against a competitor. Run a test on your page and a competitor's, then compare them directly to see where the gap is and which metric is driving it.
- Settling a template debate. Testing two versions of a product page layout? Compare their performance instead of arguing about which one "feels" faster.
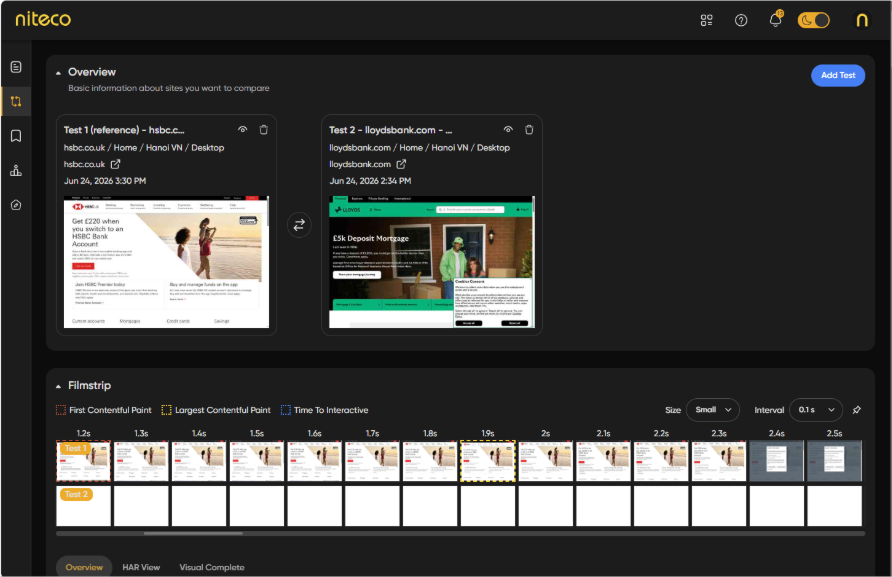
A competitor benchmark comparison, two live sites tested and compared side by side.
Comparing more than two tests at once
Two-test comparisons cover most cases, but sometimes you need to line up more, for example five regional versions of the same homepage. Bookmarking a test saves it for later instead of forcing an immediate comparison.
Click a chart point, select Bookmark Test, and it's saved to your Bookmarks page. From there, pull together as many bookmarked tests as you need into one compare session, with the same side-by-side metrics.
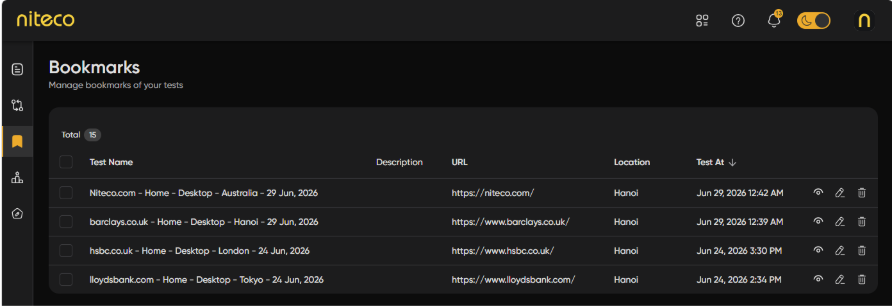
Bookmarked tests, ready to be pulled into a multi-test compare session.
For teams running the same page across multiple country domains, bookmarking a baseline test per region right after every major release gives you a fixed reference point. When something looks off in one market three weeks later, you're comparing against that saved baseline instead of guessing what "normal" used to look like.
What compare tests won't tell you
Compare tests runs on scheduled or on-demand synthetic tests, from a fixed set of locations, at a fixed point in time. It's not Real User Monitoring, and Niteco Performance Insights doesn't currently offer RUM. A comparison shows what changed between two lab test runs, not what a specific real visitor experienced on their phone during a promo. If a regression only shows up under real traffic conditions, say under load, or on a device or network your test locations don't cover, compare tests won't surface it on its own.
It also won't tell you why a business metric moved. A slower Largest Contentful Paint is a plausible contributor to a conversion dip, not proof of one. Treat compare tests as a way to isolate what changed technically, and check that finding against your business data before drawing a conclusion.
Setting this up across multiple sites or regions
If you're responsible for more than one storefront or country domain, running compare tests without a routine turns into noise fast. A few habits keep it useful:
- Run and bookmark a baseline test for each site or region right after a release, not weeks later.
- Compare new tests against that saved baseline instead of against whatever the last test happened to be.
- Filter Network Requests down to one asset type before you start guessing at a cause.
- Use Niteco Performance Insights' 23 global testing locations to catch region-specific regressions that a single-location test would miss entirely.
Summary
A dropped Lighthouse score is a symptom. Comparing two tests side by side is how you find the cause without piecing it together from memory.
Set up a baseline test for each of your regional domains today, and bookmark it, so the next time a score moves, you already have something concrete to compare it against. Start a free trial of Niteco Performance Insights to set your own comparison test.