


Introducing: Niteco Performance Insights agent on Optimizely Opal


Competitive performance benchmarking is usually a manual job. You run each competitor URL through a testing tool one at a time, screenshot the scores, paste them into a slide, and by the time the deck is finished the data is a week old. The Niteco Performance Insights agent on Optimizely Opal collapses that into a single prompt.
This post walks through what that looks like in practice, using a real scenario: a digital marketer at a UK commercial real estate firm who wants to know how their site stacks up against four competitors on mobile.
This guide covers:
- How to brief the agent and set test conditions
- What the benchmark report shows and how to read it
- Moving from a five-site comparison to a full single-site audit
- Lighthouse's new Agentic Browsing category and why it matters for AEO
- What performance testing of this kind does not tell you
What does the Performance Insights agent do in Opal?
Optimizely Opal is Optimizely's agentic AI layer for marketing teams, where agents can be tagged into a workflow and given a job in plain language. The Niteco Performance Insights agent sits there as one of those agents.
You tag it, describe the audit you want, and it connects to Niteco Performance Insights to run the tests. What comes back is an interactive report, not a wall of text in a chat window. The agent keeps the context of the conversation, so follow-up requests like "now give me the full audit for our site" don't need re-briefing.
How do you run a competitor benchmark?
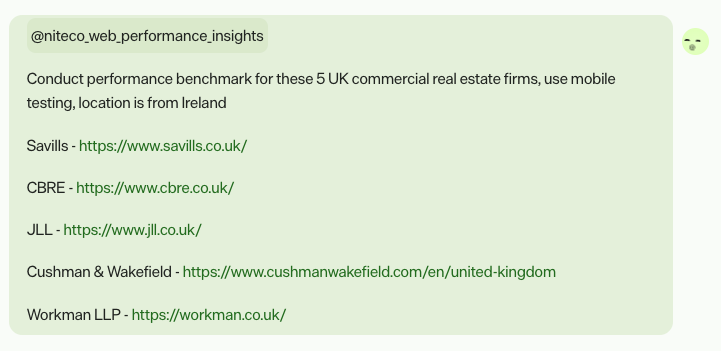
Describe the job, then paste the URLs
The brief can be conversational: benchmark five UK commercial real estate firms. Then paste the URLs you want audited. The agent picks up the relevant skills and context from that description rather than requiring a configured test profile for each site.
Set the test conditions
Test conditions decide whether the numbers mean anything. A desktop test from Virginia tells a UK mobile audience very little. In the same prompt you specify device and location, for example device: mobile and location: UK, and the agent applies those conditions across all five sites so the comparison is like for like.
Niteco Performance Insights tests from 23 locations, which matters if you are comparing brands that serve different regions or if you run country domains that should be tested where their customers actually are.
Tip: Set the test location to where your traffic converts, not where your team sits. A site that scores well from London can look very different tested from Frankfurt or Singapore.
Read the ranked comparison
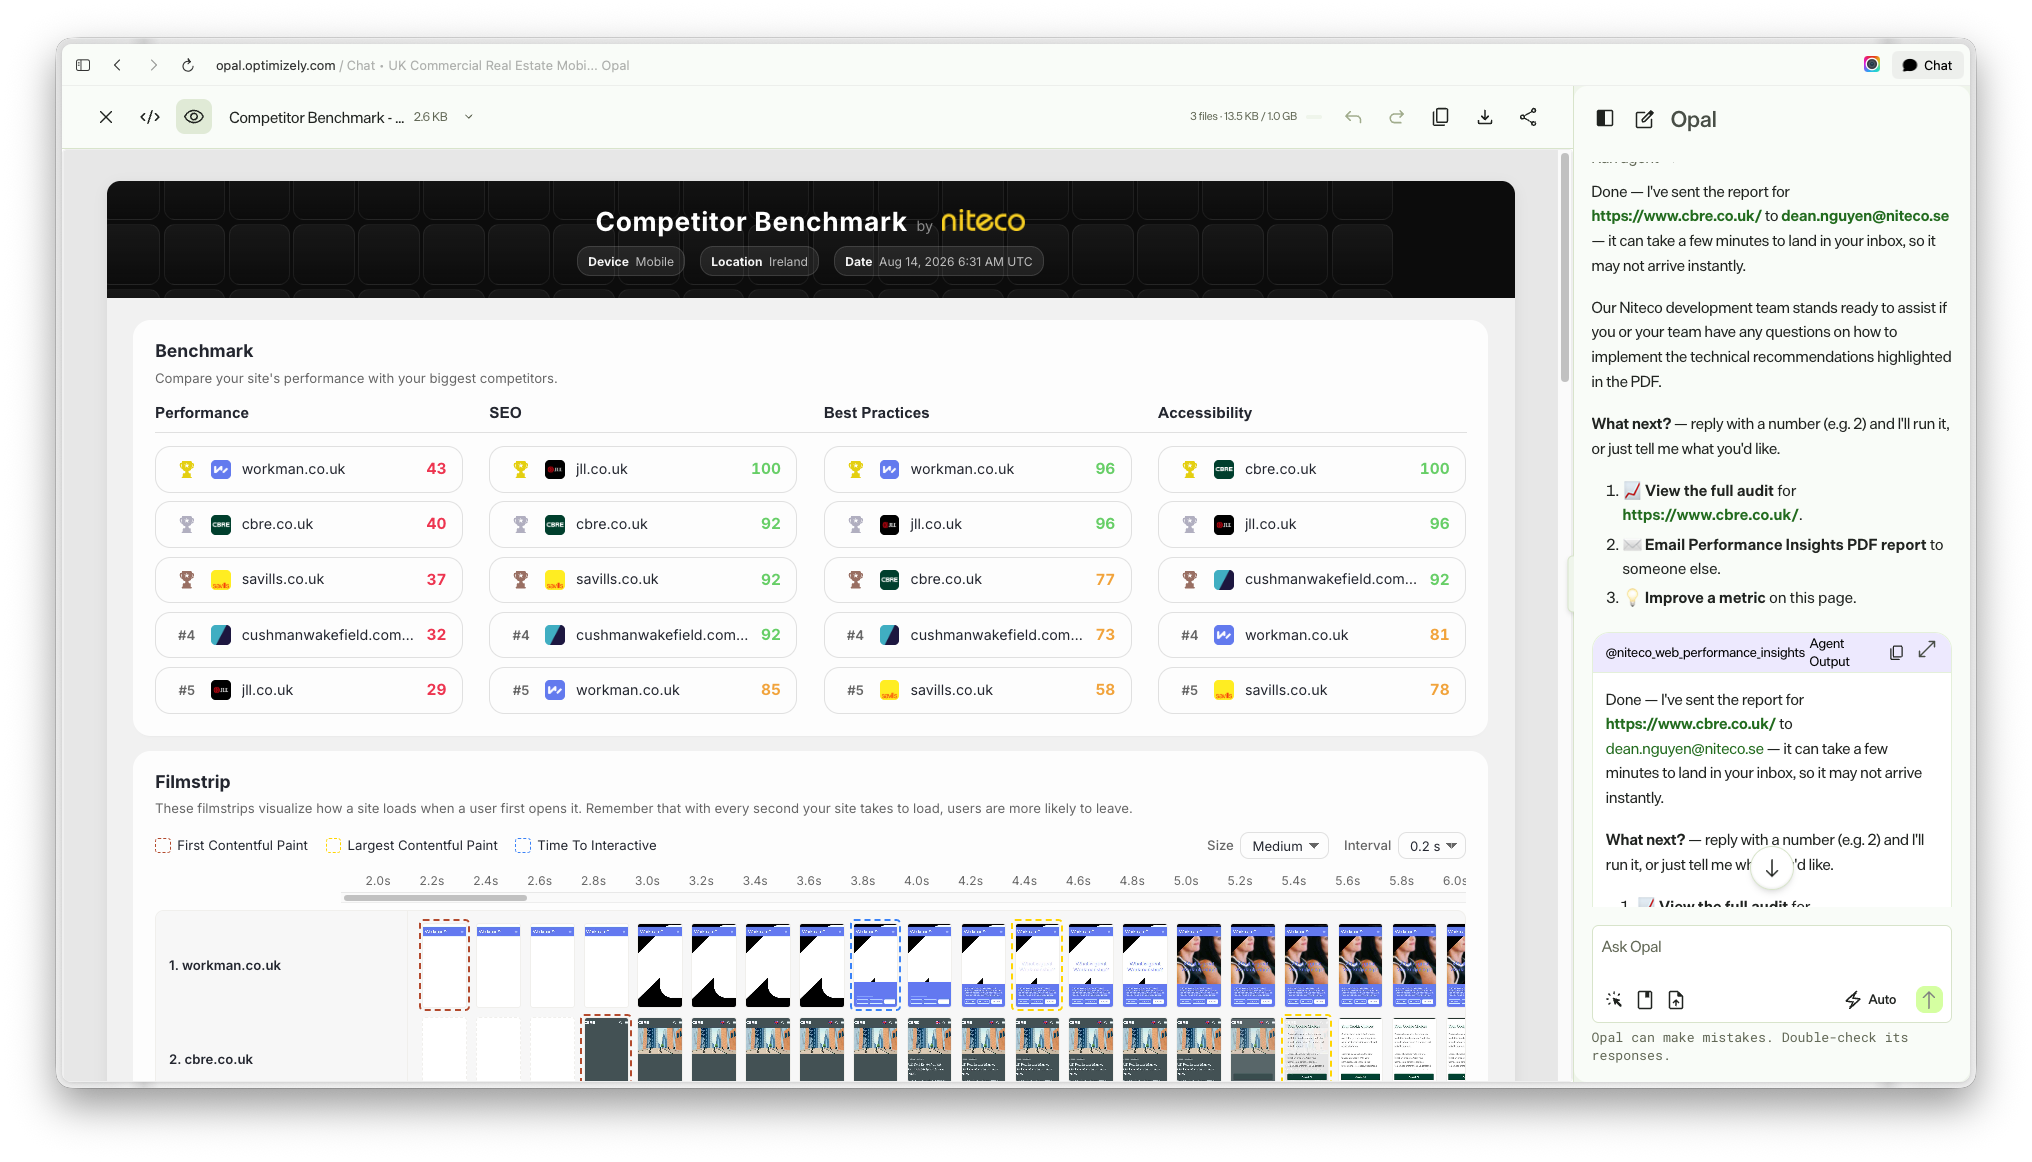
The agent returns a benchmark report with all five firms ranked by performance score. The first view is a side-by-side comparison across four Lighthouse categories:
- Performance
- SEO
- Best Practices
- Accessibility
Ranking five sites in one view answers the question most stakeholders actually ask: are we behind, and by how much.
What is in the benchmark report?
Category dashboards
Each tab opens a dashboard showing where your site is strong and where you are behind. This is where a single score becomes useful. A site can rank third overall and still be last on Accessibility, and that split is the part worth acting on.
Filmstrip and video capture
The Filmstrip section shows the page loading frame by frame, the way a real user experiences it rather than as a number. There is also a side-by-side video recording of all the pages loading together.
That side-by-side is often the most persuasive artefact in the whole report. Google's 2016 research with SOASTA found that 53% of mobile site visits were abandoned if a page took longer than three seconds to load. The figure is a decade old and thresholds have moved on since, but the underlying point holds: if your competitor's hero content is painted at 1.8 seconds and yours arrives at 4.5, a portion of your visitors never see the page at all.
Lighthouse metrics and CrUX field data
Underneath the visuals, the report carries detailed Lighthouse metrics, Core Web Vitals, and CrUX field data for every site in the benchmark. Lab data tells you what happened in a controlled test. CrUX tells you what real Chrome users experienced over the trailing collection window. Where those two disagree is usually where the interesting problem is.
How do you go from benchmark to a full audit?
Once the benchmark is on screen, the agent asks how you want to proceed. Ask for the full audit on one specific site and it runs a deep dive using the same conditions from earlier in the conversation, no re-specifying mobile or UK.
The single-site report is considerably more detailed than the benchmark:
|
|
Benchmark report |
Full site audit |
|
Scope |
Up to five sites side by side |
One site |
|
Purpose |
Where you rank, and against whom |
What to fix, in what order |
|
Categories |
Performance, SEO, Best Practices, Accessibility |
Adds Agentic Browsing |
|
Output |
Comparison dashboards, filmstrip, side-by-side video |
Per-issue recommendations with fix steps |
Agentic Browsing, AEO and GEO
The full audit includes Lighthouse's Agentic Browsing category. Google added it as an experimental category that measures how well a site is constructed for machine interaction, using deterministic pass or fail checks rather than a 0 to 100 score (Chrome for Developers: Lighthouse agentic browsing scoring). The checks cover things like WebMCP tool registration, agent-centric accessibility such as names, labels and accessibility tree integrity, and discoverability signals including llms.txt.
This is the technical foundation under a lot of the current conversation about AEO and GEO. If an AI agent cannot parse your property listings or operate your enquiry form, you are not in the answer it gives the buyer. Worth being straight about the maturity here: the category is experimental, the standards are still being proposed, and the audits require a recent Chrome build. Treat the score as an early signal rather than a target to optimise against.
Prioritised fixes
On the Performance tab, Niteco Performance Insights recommends the quickest fixes for the issues slowing the site down. Ask the agent for more specific advice on a page and it returns an interactive breakdown of the top fixes, with why each issue matters, how to resolve it step by step, and where to find it on your site. From there you can point it at a different metric.
How do you get the report to the rest of the team?
Reports export from the report view, and you choose the file format. You can also ask the agent to email the report to colleagues directly from the conversation, which removes the download-and-attach step when the person who needs it is a developer who was not in the session.
What this kind of audit does not tell you
Synthetic testing is a lab measurement. It runs a page under defined conditions and reports what happened in that run, which is exactly what you want for a fair five-way comparison, and exactly what you should not mistake for your actual user experience.
A few limits worth stating plainly:
- Niteco Performance Insights does not include Real User Monitoring. Field data in the report comes from CrUX, which is aggregated Chrome user data with its own reporting lag and eligibility thresholds, not per-session monitoring of your own traffic.
- A benchmark ranking is a snapshot. A competitor mid-deploy can score badly on the day you test them.
- Fixing a Lighthouse score does not by itself lift conversion. It removes friction that was costing you visitors, which is a different and more honest claim.
Summary
What you get from running this in Opal is the whole loop in one conversation: benchmark five sites, pick the one that matters, get the fix list, send it to the developer who will action it. That normally takes an afternoon and three tools.
If you manage several storefronts, brands, or country domains, start with a five-site benchmark against your closest competitors on mobile at your primary market location, then run the full audit on whichever of your own properties ranks worst. Before your next peak trading period is a better time to find out than during it.