


Performance Insights API: connect performance data to the tools you already use

Every test result, Lighthouse score, and Web Vital collected by Performance Insights is accessible via the REST API. Whether that's feeding data into a custom dashboard, triggering tests automatically after a deploy, or managing sites without touching the UI, the API is what connects Performance Insights to the rest of a development workflow.
Authentication
All requests authenticate with a Personal Access Token sent as a request header:
x-api-key: YOUR_API_KEYThe token is in User Information, accessible from the account menu in the top right of the screen. Super Admins can view and manage tokens for any client from the Clients screen, and regenerate them from there if needed.
The base URL for all v1 endpoints is https://perfmon.niteco.com/api/v1. Every response returns JSON.
Triggering tests
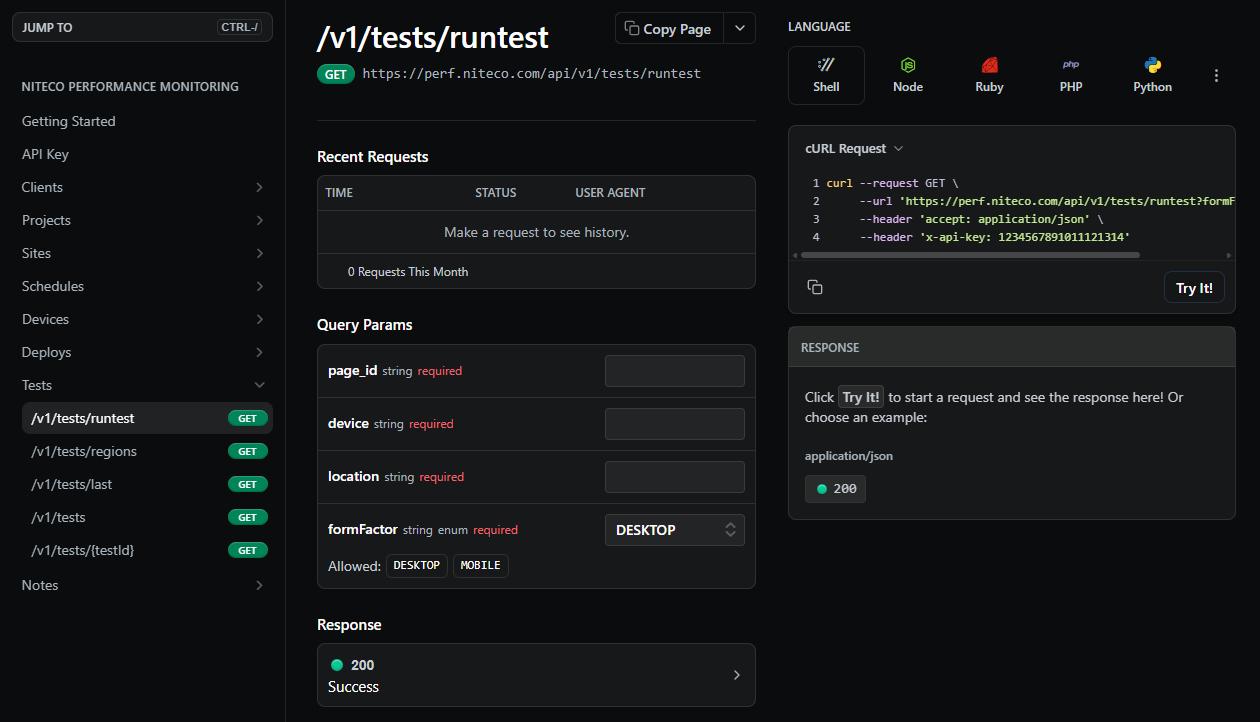
Tests can be triggered on demand against any page — passing a page ID, device, location, and form factor. The response returns a test ID, which is then used to retrieve the results once the test completes.
This is how most teams integrate testing into a deployment pipeline. A test fires after each release, results come back against the same page, and scores can be tracked across deploys directly in Performance Insights.
Retrieving results
A single test result returns the full Lighthouse payload — performance, accessibility, SEO and best practices scores alongside Core Web Vitals: LCP, FCP, CLS, TBT, Speed Index and Time to Interactive.
For pulling results across multiple pages, the API supports fetching the most recent tests for a set of page IDs, with optional date range filtering. Network requests, Lighthouse audits, and filmstrip thumbnails can all be included in the response.
For reporting tools, a dedicated endpoint returns complete test data across projects, sites, pages, devices, and locations — this is the endpoint used by the Power BI and Looker Studio integrations.
Logging deploys
Deploys can be recorded against a site via the API. Performance Insights shows these as markers on charts, making it straightforward to see whether a release improved scores or introduced a regression — without manually cross-referencing deployment timestamps with test results.
CI/CD integration
The API works with any pipeline that can run a shell command. Git hooks can log a deploy before a push. GitHub Actions, GitLab CI, and Jenkins can all trigger a test in a pipeline step with a single curl call.
Full examples for each are in the integration guides at perfdocs.niteco.com/docs/guides.
Dashboards and reporting
Performance Insights connects directly to Google Looker Studio via a community connector. Authenticate with a Personal Access Token, select the client, sites, devices, and locations, and the data feeds through automatically for building custom reports and visualisations.
For Power BI, connect to the tests endpoint as a web data source with the token in the request header. Project, site, page, device, location, and date range parameters control what data is returned, covering full Lighthouse scores, Web Vitals, and historical trends.
MCP Server
For teams using AI assistants in their editor or chat interface, Performance Insights also provides an MCP Server. It exposes the same capabilities — running audits, retrieving results, pulling CrUX data, generating PDF reports — directly inside tools like Cursor, VS Code, Claude, and ChatGPT, without writing API calls manually. Developers can investigate performance issues and get fix recommendations without leaving their coding environment, and product managers can pull reports directly from a chat interface.
Full setup guides at https://perfdocs.niteco.com/docs/mcp-server
Get started
- Full API reference — https://perfdocs.niteco.com/reference
- API key guide — https://perfdocs.niteco.com/docs/api-keys