


Site Change Alerts: Catch Page Regressions Automatically


TL;DR
Site Change Alerts compare each test run against the one before it and notify you when a page's resources or console log output change, whether that's a new console error, a resource that suddenly got heavier, or a new network request. Alerts are scoped at the site level, configurable per change type with custom size thresholds, and delivered by email, Slack, Microsoft Teams, or webhook. Each notification links to a compare session showing the exact difference, split by Desktop and Mobile.
A deploy ships. A marketing team adds a new tag manager container. A CDN swaps a font file. None of that shows up as a failed test, so nobody notices until a page feels slower or a support ticket mentions a broken script. Site Change Alerts, released as part of Niteco Performance Insights' alerting system, exist to catch that category of regression: the kind that doesn't break a test, just quietly makes a page worse.
This post covers what the feature actually tracks, how it's scoped and configured, what an alert looks like when it lands in your inbox, and where its limits are.

What is a Site Change Alert?
A Site Change Alert fires when Niteco Performance Insights detects a difference in a page's resources or console log output between two consecutive test runs. Instead of waiting for someone to open the dashboard and compare numbers by eye, the system does that comparison automatically after every run and tells you when something changed.
The official framing from the product documentation: it "notifies you when a page's resources and console log alerts/warnings change between test runs, so you don't have to keep checking the dashboard to catch a regression." That's the whole premise. It isn't a new testing method or a new metric category. It's a diff, run automatically, with a notification attached.
What does it actually track?
Three categories of change trigger a Site Change Alert.
New console errors and warnings
If a page starts throwing a JavaScript error or console warning that wasn't there in the previous run, that's flagged. This is often the first sign that a third-party script broke, a dependency version shifted, or a code change introduced something the browser doesn't like.
Resource size changes
When a resource on the page (a script, a stylesheet, an image) grows or shrinks past a defined threshold between runs, the alert catches it. An unoptimized image getting pushed to production, or a bundler suddenly outputting a much larger JavaScript file, shows up here before it shows up as a slower Largest Contentful Paint.
New network requests
A page pulling in a request it wasn't making before, commonly a new third-party script, tracking pixel, or embedded widget, gets logged as a change. This is one of the more useful categories for teams managing sites where marketing and engineering both ship changes, since a tag added through a tag manager doesn't always go through the same review as a code deploy.
Changes are tracked separately for Desktop and Mobile, since a resource or script that only loads on one device type would otherwise get lost in an averaged view.
How Site Change Alerts are scoped and configured
Site Change Alerts sit inside the same alert hierarchy as the rest of Niteco Performance Insights' alerting system, which applies settings at the Client, Project, or Site level with cascading inheritance. A setting configured at the Project level applies to every site under it unless a specific site overrides it. Site Change Alerts themselves are configured at the Site level, the most granular tier, through the Edit Site dialog.
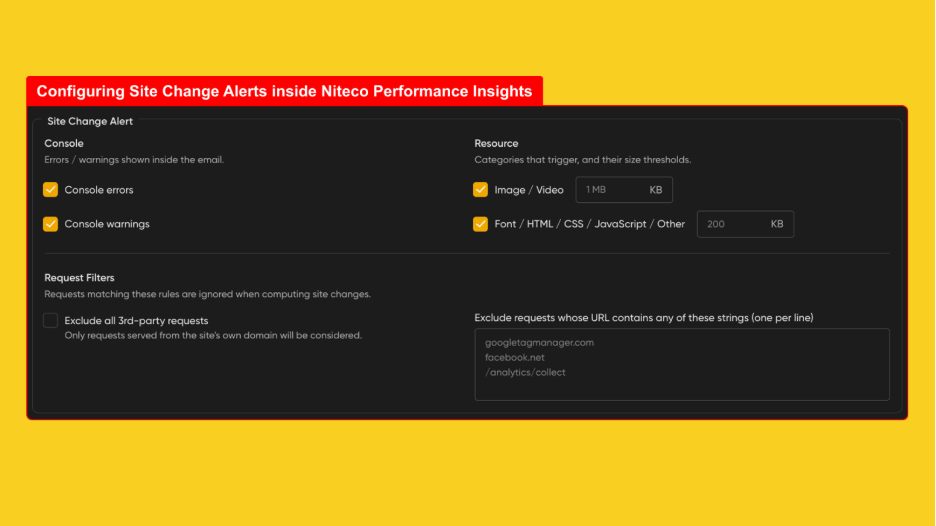
From there, configuration breaks down into a few controls:
- Custom size thresholds. You set the threshold that defines when a resource size change counts as significant, which is what keeps the alert from firing on trivial byte-level fluctuations.
- Exclusions by domain or URL substring. You can exclude requests by root domain or by a substring in the URL, useful for filtering out known-noisy third parties (an ad network that rotates its own asset hashes on every load, for example) that would otherwise generate alerts with no actionable signal.
- Opt-in via the "Site Change" checkbox. The alert type is enabled or disabled in Alert Settings by checking or unchecking "Site Change" alongside your other alert preferences.
Tip: Set a size threshold before you turn the alert on for a high-traffic or high-change page. Without one, a site that ships frequent minor CSS or script updates will generate more noise than signal, and the alert stops getting read.
How alerts reach you
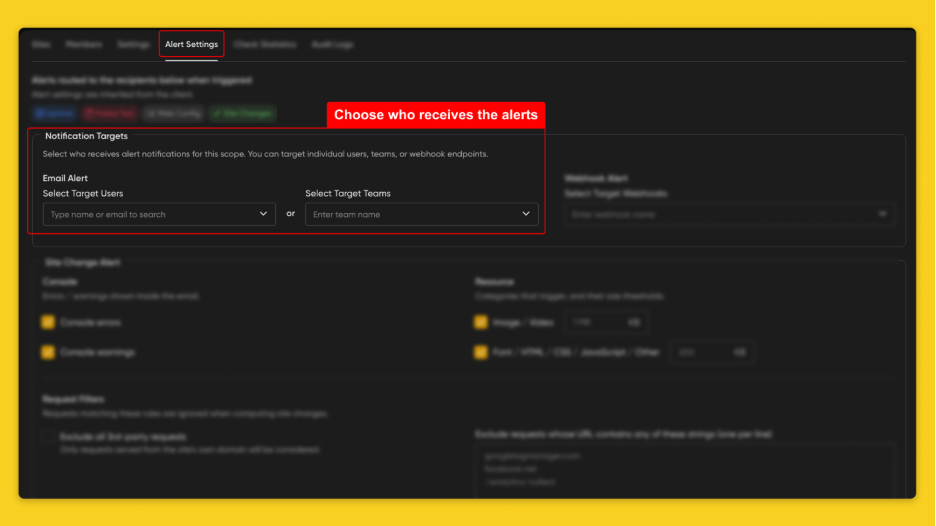
Site Change Alerts go out through the same channels as the rest of the alerting system: email Slack, Microsoft Teams, or a custom webhook. That matters for how the alert actually gets used. A solo developer might be fine with email. A team running several storefronts across regions is more likely to route these into a shared Slack channel so a change on the AU site and a change on the UK site land in the same place, visible to whoever's on point that week rather than sitting in one person's inbox.
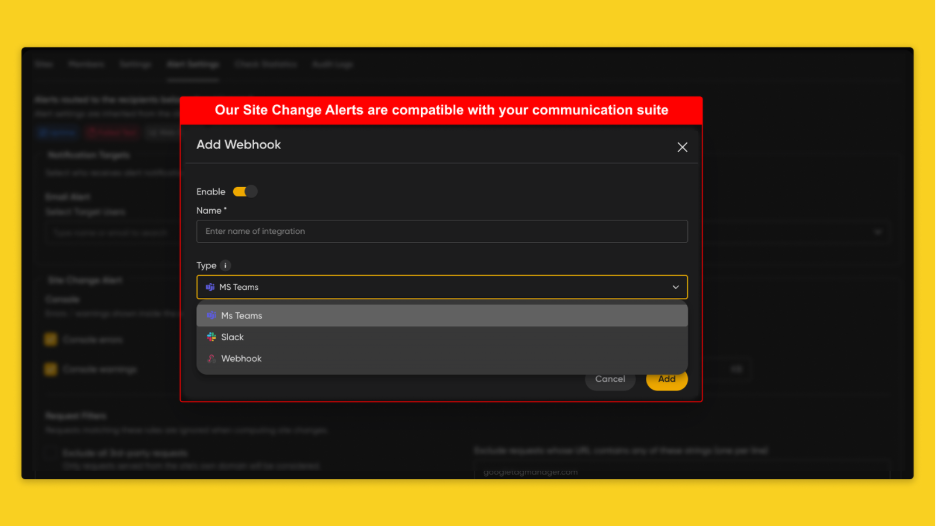
What a Site Change Alert looks like
Each notification is scoped to one site, with one section per page, and changes inside that section are grouped by resource type. If three pages on a site changed between runs, the alert shows three sections, not three separate emails.
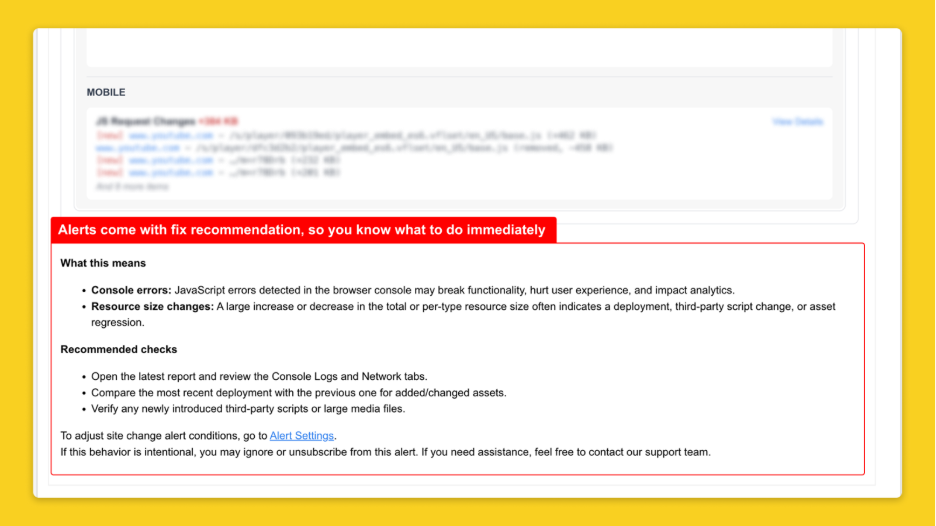
When Site Change Alerts are actually useful
A few scenarios where this earns its place in a monitoring setup:
- Post-deploy verification. Instead of manually checking a page after every release, a Site Change Alert tells you whether the deploy introduced a new console error or changed a resource's footprint, without anyone having to remember to look.
- Third-party script governance. Marketing and sales teams often add tags, pixels, and embeds through a tag manager, outside the normal code review process. A new network request alert is often the first signal that something was added.
- Multi-site consistency checks. If you run the same template across several country domains or storefronts, a change that should be uniform (a shared header script, a common analytics tag) but only shows up as a Site Change Alert on one domain is worth investigating. It can mean a regional deployment drifted from the others.
- Catching regressions between scheduled audits. If your team runs full Lighthouse audits weekly but tests more frequently for uptime and change detection, Site Change Alerts fill the gap between those audits, flagging what moved without waiting for the next scheduled deep dive.
What Site Change Alerts don't do
Worth being direct about the limits here, because the feature is easy to over-trust if you don't know what it's actually comparing.
It detects change, not correctness. A resource getting smaller is flagged the same way a resource getting larger is. The alert tells you something is different, not whether that difference is good, bad, or intentional. A legitimate image compression pass and an accidental asset regression both show up as a "resource size change," and it's on you to look at the compare session and decide which one happened.
It's synthetic, not real user monitoring. Niteco Performance Insights does not include RUM, so Site Change Alerts compare scheduled test runs against each other, not live sessions from your actual visitors. If your test schedule runs the audit once a day, a change that appears and gets rolled back within a few hours can pass through undetected between two runs. The alert is only as current as your test frequency.
It doesn't diagnose the cause. The compare session shows you what changed, not why. A new console error tells you there's an error; finding the commit, tag, or third-party update that caused it is still a manual step.
Note: If you're managing a high-change site (frequent deploys, active marketing tagging), pair Site Change Alerts with sensible thresholds and domain exclusions from day one. Configured loosely, the feature produces a high volume of low-value notifications and gets ignored, which defeats the point of having it.
Summary
Site Change Alerts close a specific gap: the regressions that don't fail a test but still degrade a page, a new console error, a heavier asset, an unreviewed third-party script. They compare consecutive test runs automatically, flag differences by resource type and device, and route the notification wherever your team already watches for alerts.
If you're running Niteco Performance Insights across multiple sites or storefronts, the place to start is the Edit Site dialog for your highest-traffic or highest-change property: turn on the change types that matter to you, set a size threshold that filters out noise, and exclude the third-party domains you already know are irrelevant. From there, expand to the rest of your sites once you know the alert volume is telling you something useful rather than just being loud.
FAQ
What triggers a Site Change Alert?
Three things: a new console error or warning, a resource crossing a defined size threshold between test runs, or a new network request that wasn't present in the previous run.
Where are Site Change Alerts configured?
At the Site level, in the Edit Site dialog, which sits inside Niteco Performance Insights' broader alert hierarchy of Client, Project, and Site-level settings with cascading inheritance.
Can I turn off alerts for specific types of change?
Yes. Console log alerts, resource size alerts, and new request alerts each have their own toggle, so you can enable only the change types relevant to your site.
How do I stop noisy third-party requests from triggering alerts?
Exclude them by root domain or by a URL substring in the alert configuration. This is the main way to filter out known third parties, like ad networks or embedded widgets, that generate frequent but low-value changes.
Which channels can Site Change Alerts be sent to?
Email, Slack, Microsoft Teams, or a custom webhook, the same delivery options available across Niteco Performance Insights' alerting system.
Do Site Change Alerts track Desktop and Mobile separately?
Yes. Changes are tracked independently for each device type, so a script or resource that only loads on mobile won't get missed in a desktop-only comparison.
Is this feature based on real user data?
No. Niteco Performance Insights does not include Real User Monitoring, so Site Change Alerts compare scheduled synthetic test runs against each other, not live visitor sessions. A change that happens and reverts between two scheduled runs won't be caught.
Does the alert tell me what caused the change?
No. It links to a compare session showing exactly what changed and by how much, but identifying the deploy, tag, or update responsible is still a manual investigation.
|
Change type |
What triggers it |
Typical cause |
|
Console error/warning |
New browser console output not present in the prior run |
Broken script, dependency change, deprecated API |
|
Resource size change |
A resource crosses your defined size threshold |
Unoptimized asset, larger bundle, new library version |
|
New network request |
A request the page wasn't making before |
New third-party tag, widget, tracking script |