


What are web vitals? A complete guide to LCP, INP, and CLS


Web Vitals are the metrics Google uses to judge whether a page feels fast, responsive, and visually stable to the people actually using it. If a page looks fine in a screenshot but still loses visitors, the reason is usually sitting in one of these numbers.

This guide covers:
- What Web Vitals are, and how they differ from the narrower Core Web Vitals set
- The three Core Web Vitals metrics (LCP, INP, CLS) and their pass/fail thresholds
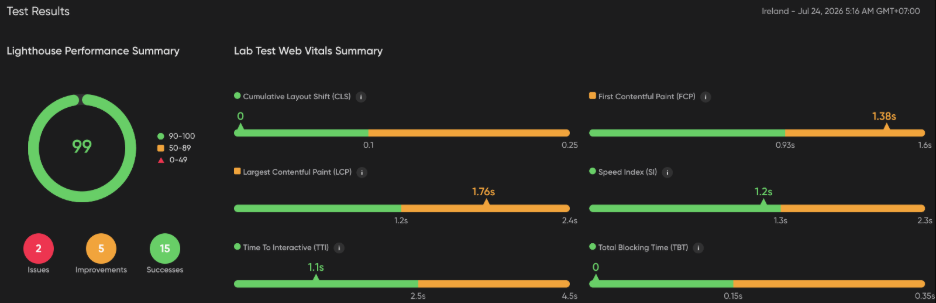
- Supporting metrics like FCP, TTFB, and TBT, and what each one tells you
- Why Web Vitals affect SEO and revenue, with real case study numbers
- How Google actually measures these scores, and where lab data and field data disagree
- How to check and improve Web Vitals on one site, or across dozens of storefronts and domains
What are Web Vitals?
Web Vitals is an initiative Google started to give site owners a small, unified set of quality signals instead of a sprawling list of performance metrics that only specialists understood. The full Web Vitals set includes both the headline Core Web Vitals and supporting metrics that help diagnose them.
Core Web Vitals are the subset that Google considers essential for every page: Largest Contentful Paint (LCP), Interaction to Next Paint (INP), and Cumulative Layout Shift (CLS). These three get measured across Google's own tools (Search Console, PageSpeed Insights, Chrome UX Report) and factor into how Google assesses page experience in Search.
The other Web Vitals, like First Contentful Paint or Time to First Byte, aren't Core Web Vitals themselves, but they help explain why a Core Web Vital is failing.
What are the three Core Web Vitals metrics?
Each Core Web Vital is scored against a "good" threshold measured at the 75th percentile of page visits, split by mobile and desktop. A page needs to hit "good" on all three, at that percentile, to fully pass.
|
Metric |
What it measures |
Good |
Needs improvement |
Poor |
|
LCP |
Loading speed |
≤2.5s |
2.5s–4s |
>4s |
|
INP |
Responsiveness |
≤200ms |
200ms–500ms |
>500ms |
|
CLS |
Visual stability |
≤0.1 |
0.1–0.25 |
>0.25 |
Largest Contentful Paint (LCP)
LCP measures how long it takes the largest visible element, usually a hero image, video poster, or a large block of text, to render on screen. It's the closest proxy Google has for "when does this page feel loaded" from the user's point of view.
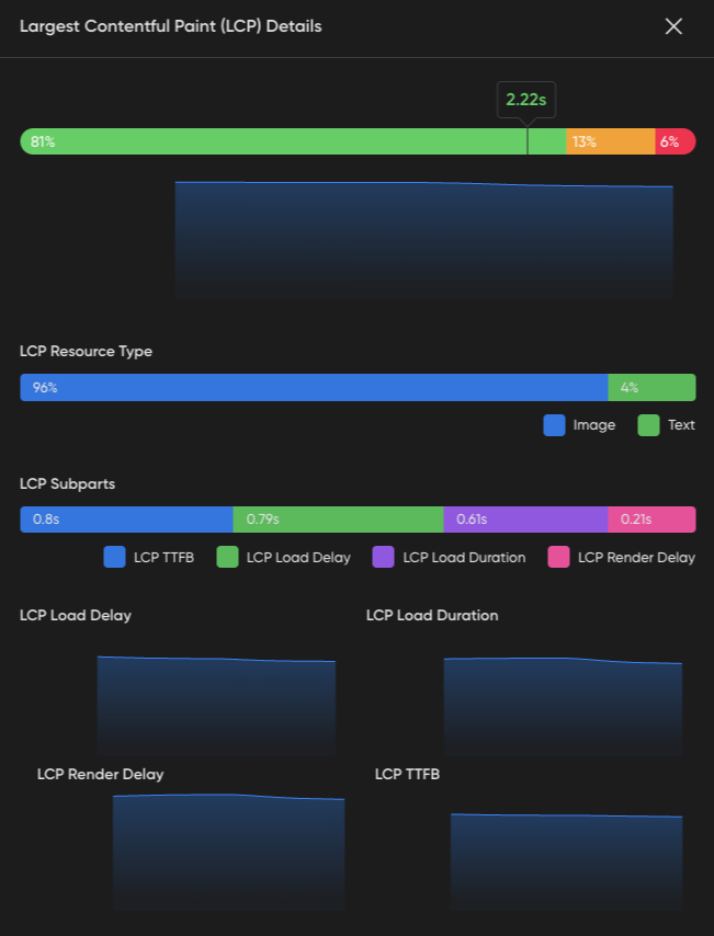
Slow LCP is almost always one of four culprits: slow server response time, render-blocking CSS or JavaScript, unoptimized images, or client-side rendering that delays the main content behind a JavaScript bundle. Fixes typically involve compressing and correctly sizing images, preloading the LCP element, cutting render-blocking resources, and moving critical content out of client-side JavaScript where possible.
Interaction to Next Paint (INP)
INP measures responsiveness: the delay between a user's click, tap, or keypress and the next time the browser visually responds. Unlike its predecessor, INP looks at every interaction across the full page visit and reports the worst (or near-worst) one, not just the first click.
INP replaced First Input Delay (FID) as the third Core Web Vital in March 2024. FID only measured the delay before the first interaction. INP captures responsiveness across the entire session, which is why sites that looked fine under FID sometimes show a "poor" INP score once real interaction data comes in.
Poor INP usually traces back to long JavaScript tasks blocking the main thread. Breaking up long tasks, deferring non-critical scripts, and reducing the amount of JavaScript that runs in response to user input are the standard fixes.
Cumulative Layout Shift (CLS)
CLS tracks unexpected movement of visible content, the classic case of a page jumping around as images, ads, or fonts load in. It's scored as a unitless number: the lower, the more stable the layout.
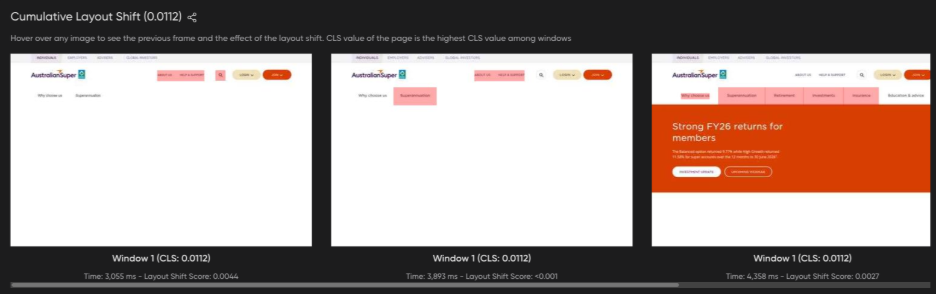
The usual causes are images or ads rendered without a reserved size, web fonts that swap in and reflow text, and content injected above what's already on screen (a banner that pushes everything down after the page has settled). Setting explicit width and height or a CSS aspect-ratio on images and ad slots, and never inserting new content above existing content, resolves most CLS issues.
Tip: CLS is usually the cheapest of the three metrics to fix. Reserving space for ads and images is a smaller engineering lift than rewriting a JavaScript bundle to fix INP, and it tends to produce a very fast, visible score improvement.
What other metrics support Core Web Vitals?
These aren't Core Web Vitals, but they help diagnose why a Core Web Vital is off, and some are the only version of that signal you can measure in a lab environment before real users ever see the page.
|
Metric |
What it tells you |
Good threshold |
|
First Contentful Paint (FCP) |
Time until any content renders |
≤1.8s |
|
Speed Index (SI) |
How quickly the page visibly fills in |
Lower is better |
|
Time to Interactive (TTI) |
When the page becomes fully usable |
≤5s |
|
Total Blocking Time (TBT) |
Main-thread time blocked by long tasks; the lab proxy for INP |
≤300ms |
TBT deserves a specific mention: because INP requires a real user interacting with the page, lab tools like Lighthouse can't measure it directly. They report TBT instead, since work that blocks the main thread in a lab test tends to predict a poor INP in the field. That gap between what a lab tool can see and what Google actually uses to rank a page is worth understanding before you optimize.
How to check your Web Vitals scores
A few tools cover most needs, each suited to a different question:
- Niteco Performance Insights: not only can users get a snapshot of their Core Web Vitals, but they can also track it overtime, compare scores with competitors, or monitor vitals in different locations and devices automatically.
- PageSpeed Insights: free, single-URL snapshot combining both lab and field data. Good for a quick check on one page.
- Search Console's Core Web Vitals report: site-wide field data trends, grouped by URL pattern, straight from CrUX.
- Chrome UX Report (CrUX): the raw public dataset behind both tools above, queryable directly if you want to build your own reporting.
- The web-vitals JavaScript library: lets you capture your own real-user data and send it to whatever analytics tool you already use.
Checking one URL at a time in PageSpeed Insights works fine for a single site. It stops working once you're responsible for a dozen regional storefronts or client sites, because there's no single view across all of them. This is where Niteco Performance Insights fits in: it runs synthetic Web Vitals tests from 23 global test locations and surfaces LCP, INP, and CLS for every site you manage in one Web Vitals View dashboard, instead of switching between separate PageSpeed Insights checks per brand or country domain.
Why do Web Vitals affect SEO and revenue?
Google states plainly that Core Web Vitals are one part of a broader page experience assessment that "aligns with what our core ranking systems seek to reward." That's a real ranking input, not a rumor, but it's worth being precise about what it does and doesn't do: Core Web Vitals can act as a tie-breaker between pages of similar relevance and quality. It does not override content relevance, and passing all three metrics does not guarantee a ranking jump on its own.
Where the business case gets concrete is in Google's own published case studies:
- Vodafone Italy improved LCP by 31% and saw 8% more sales.
- Tokopedia cut LCP by 55% (from 3.78s to 1.72s) and saw a 23% increase in average session duration.
- Redbus reduced CLS from 1.65 to near 0 and reported an 80 to 100% increase in mobile conversion rate across several country properties, alongside a reported 192% domain ranking increase in one market.
- Rakuten 24 ran a controlled A/B test comparing a Core Web Vitals–optimized landing page against the original. The optimized version produced a 53.37% increase in revenue per visitor, a 33.13% increase in conversion rate, and a 35.12% reduction in exit rate.
That last one is worth flagging as the strongest evidence of the group: it's a controlled A/B test, not just a before/after comparison, so the LCP and CLS improvements are more clearly the cause rather than a coincidence. Full details on all of the above are in Google's business impact case study collection.
None of this means every site will see numbers like these. Results depend on how poor the starting scores were, how much traffic the page gets, and what else changed at the same time. Treat these as evidence that the investment can pay off, not as a guaranteed return.
How does Google actually measure Web Vitals?
Google's ranking systems use field data: real measurements from real Chrome users, aggregated in the Chrome User Experience Report (CrUX). This is different from lab data, which comes from a single simulated test run on a fixed device and network profile, the kind of result you get from Lighthouse or a synthetic testing tool.
Lab and field scores frequently disagree, and that's expected rather than a sign something is broken. A lab test reflects one scripted run under fixed conditions. Field data reflects the full, messy mix of devices, connection speeds, and real interactions your actual visitors bring to the page. A page can pass in the lab and still fail in the field if a meaningful share of real visitors are on older phones or slower networks the lab test never simulated.
For ranking purposes, Google looks at field data at the URL level first, falling back to a site-wide (origin) average if a specific URL doesn't have enough traffic to generate reliable CrUX data on its own.
How to improve Core Web Vitals across one site or many
Most fixes fall into a short list of recurring patterns:
- Compress and correctly size images, and serve them through a CDN or modern format.
- Defer or remove non-critical JavaScript, and break up long tasks that block the main thread.
- Reserve space for images, embeds, and ads with explicit dimensions or aspect-ratio.
- Preconnect or preload the resources that make up your LCP element.
- Audit third-party scripts (chat widgets, ad tags, analytics snippets) since these are common, easily overlooked sources of both slow INP and layout shift.
For teams running the same storefront template across multiple regions or brands, the harder problem usually isn't knowing how to fix LCP or CLS. It's noticing that one regional deploy quietly regressed while the others stayed fine. Setting threshold alerts on LCP, INP, and CLS per site means a regression on any single domain gets flagged automatically instead of surfacing three weeks later in a quarterly report. If you want to see how your scores stack up against direct competitors rather than just against Google's thresholds, competitive benchmarking runs the same test against a competitor's URL for a like-for-like comparison.
Summary
Web Vitals quantify something that used to be a gut feeling: does this page feel fast and stable to the person using it. LCP, INP, and CLS are the three that matter most for both SEO and conversion, and the case study data above shows the business case is real, even if results vary by site.
If you manage more than one site, checking each one by hand in PageSpeed Insights doesn't scale. Set up a Web Vitals test across every storefront or regional domain in Niteco Performance Insights, then add threshold alerts on LCP and CLS so a regression gets caught before it reaches a launch or a peak sales period, not after.
FAQ