


Website Monitoring for Publishers During Traffic Spikes


TL;DR
- The minutes when a story breaks are when your ad inventory and subscription prompts are worth the most, and when a slow or unavailable page sends readers to the next search result.
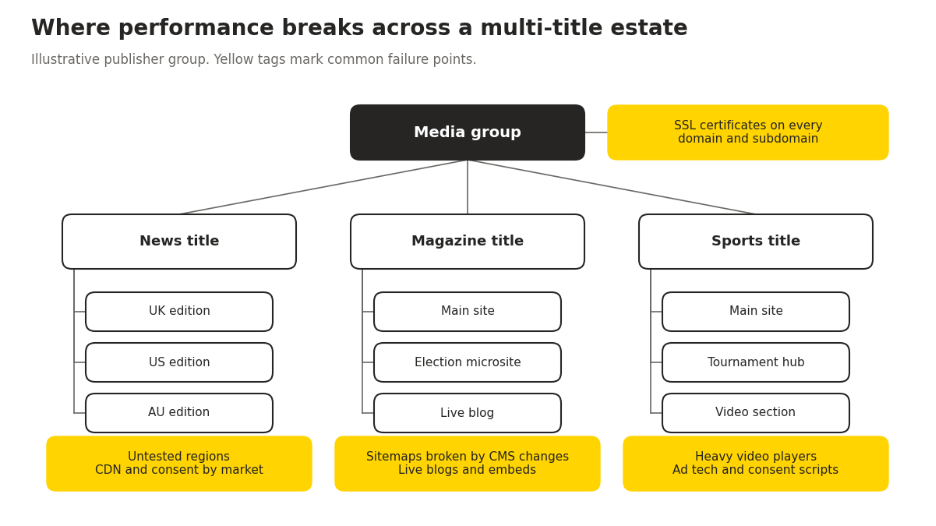
- Multi-title publishers usually break in predictable places: scripts added over time, live blogs and embeds, video players, CMS changes, untested regional editions, and certificates across many domains.
- Always-on monitoring across every title catches outages and regressions as they happen. A one-off speed test only tells you how a page behaved at the moment you ran it.
A newsroom can plan a launch, but it can't schedule a breaking story. When an election result lands or a match goes to extra time, traffic to your titles can multiply within minutes, and that's the window where every page view carries ad impressions, subscription prompts, and a chance to turn a search visitor into a regular reader.
It's also the window where a slow page or a failed origin costs the most. A reader who hits a spinner during a live event has a dozen other results one tap away.
This guide covers:
- What a slow or unavailable site costs during a spike
- Where performance tends to break for multi-title publishers
- Why one-off tests miss spike-time problems
- A setup checklist for planned high-traffic events
- How to build the business case with editorial and commercial leadership
The Cost of Slow Pages and Downtime During a Spike
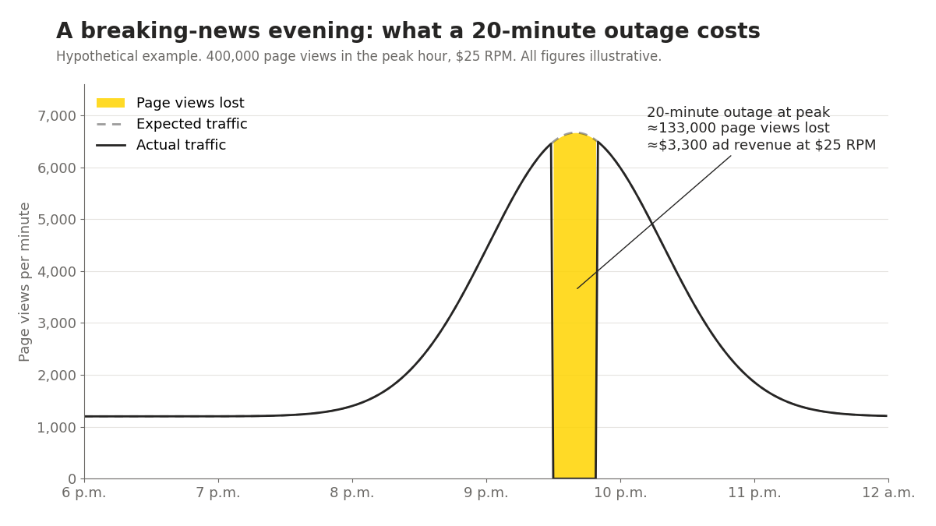
A simple cost model
You don't need industry benchmarks to estimate exposure. Three numbers from your own analytics and ad reporting are enough: page views per peak hour, revenue per thousand page views (RPM), and the minutes affected.
Revenue at risk = (page views per peak hour ÷ 60) × minutes affected × share of page views lost × (RPM ÷ 1,000)
Here's a hypothetical example. Every figure below is invented for illustration. Replace them with your own.
|
Scenario (hypothetical) |
Page views per peak hour |
Minutes affected |
Share of page views lost (assumed) |
Page views lost |
RPM |
Ad revenue lost |
|
Full outage, one title |
400,000 |
20 |
100% |
133,333 |
$25 |
$3,333 |
|
Slow pages, one title |
400,000 |
60 |
20% |
80,000 |
$25 |
$2,000 |
|
Full outage, three titles on shared infrastructure |
1,200,000 |
20 |
100% |
400,000 |
$25 |
$10,000 |
What the model leaves out
The table counts display revenue only. It doesn't count subscription starts that never happened because the paywall prompt didn't load, or readers who found a competing title that night and kept going back. Those losses are harder to measure and probably larger for subscription-led publishers.
The "slow pages" row also depends on an assumption. How many readers leave when a page takes an extra few seconds varies by title, device, and how urgent the story is. Treat the 20% as a placeholder until you have your own data.
Where Performance Breaks for Multi-Title Publishers
Ad tech and consent scripts that pile up
Each new header bidding partner, analytics tag, or consent update adds requests to the page. Few of them get removed. Over a year, a template that loaded cleanly can pick up enough third-party script to push its main content back by seconds, and nobody on the editorial side sees it happen because each addition looked small.
Live blogs and embeds
Live blogs are long, constantly updated pages packed with social embeds, video clips, and polling widgets. They also get the heaviest traffic on the biggest nights. A single slow embed provider can hold up the page for everyone reading it.
Video players
Autoplay players are often the heaviest single item on an article page. If the player loads before the headline and first paragraph, readers wait for the thing they didn't come for.
Sitemaps broken by CMS changes
A template update, URL migration, or plugin change can quietly break a sitemap or drop sections from it. On a normal day that might go unnoticed for weeks. During a spike, new articles that search engines can't discover quickly are articles that miss their moment.
Regional editions nobody tests from their region
A UK, US, and Australian edition can share a codebase and still behave very differently, because of CDN configuration, regional ad partners, or consent rules that only fire in one market. If your team tests everything from one office, the edition furthest away is the one most likely to be slow without anyone knowing.
SSL across many title domains
A group with a dozen titles, regional subdomains, and campaign microsites has a lot of certificates to renew. One missed renewal puts a browser warning in front of every reader on that domain, and it tends to surface at the worst possible time because nobody was watching it.
Niteco Performance Insights covers several of these from one place. It runs sitemap checks and SSL monitoring across your sites, and site change alerts flag when page resources or console warnings change between test runs. That last one is useful when a new ad or consent script appears on a template without anyone announcing it. For regional editions, you can test from 23 locations, so each edition can be checked from the market it serves. See this blog on comparing website performance tests for how to read the differences between two runs.
Why One-Off Speed Tests Miss Spike-Time Problems
What a single test can tell you
A one-off test from a free lab tool such as PageSpeed Insights or Lighthouse is a good way to diagnose one page. It shows you what loaded, in what order, and which requests held up rendering. But it's a snapshot from one place at one moment. It can't tell you that the site went down at 9:42 p.m., that a script was added on Tuesday, or that the Australian edition has been slow all week.
How the main approaches compare
|
Approach |
What it's good for |
What it misses |
|
One-off lab test (free tools) |
Diagnosing a single page on demand |
Outages, changes over time, other regions, other titles |
|
Scheduled synthetic monitoring |
Consistent baselines, regressions, outages, regional checks, many sites at once |
How individual readers on their own devices and networks experience pages |
|
Real user monitoring (RUM) |
Reader-level data across real devices, networks, and locations |
Clean controlled comparisons; it only reports on traffic you already have, so it won't flag an outage the way a direct check does |
|
Google's field data (CrUX) |
Aggregated view of how Chrome users experience your pages |
Rolling averages over weeks, so it's too slow for spike-time alerting |
Where synthetic monitoring stops
Niteco Performance Insights is a synthetic monitoring tool. It does not offer real user monitoring. Synthetic tests load your pages under controlled conditions on a schedule, which makes them good at the things that matter most during a spike: consistent baselines, catching regressions and outages fast, and checking every region and title the same way.
What synthetic tests can't show you is how a specific reader on an older phone and a weak connection experienced your live blog. If your team needs that reader-level view, pair a synthetic monitoring tool with a RUM tool. They answer different questions.
Tip: Set up uptime alerts and change alerts across every title before your next planned high-traffic event.
A Setup Checklist for Planned High-Traffic Events
Some spikes you can see coming: election nights, tournament finals, award shows, major product launches covered live. For those, there's time to prepare.
Two weeks out
- List every domain and edition that will carry coverage, including live blog URLs and any microsites.
- Confirm SSL certificate expiry dates for each domain.
- Check sitemaps on every title, especially if the CMS or templates changed recently.
- Run baseline tests on the homepage, a standard article, and a live blog template from each edition's region.
One week out
- Turn on uptime monitoring for every URL on the list. Niteco Performance Insights checks every minute by default and can send alerts to email, Slack, or Microsoft Teams, so the alert lands in the channel your on-call team already watches.
- Set threshold alerts on Largest Contentful Paint (LCP) for the live blog and article templates.
- Agree a code and tag freeze with ad operations and product. No new scripts on event templates without a test run first.
On the day
- Keep the uptime channel visible to whoever is on call, both technical and editorial.
- Watch change alerts for anything new on event templates.
- When a site recovers, the recovery notice includes how long it was down. Log it for the post-event review.
After the event
Compare your event-night tests with the baseline. This blog on A/B performance testing covers how to check whether a fix helped before it goes to production for the next event. Note what changed, what alerted, and how long any issue lasted. That record is the start of your business case.
Building the Business Case With Editorial and Commercial Leadership
Speak in traffic and revenue, not milliseconds
Editorial leaders care about whether readers could get to the story. Commercial leaders care about impressions served and subscriptions started. Neither group will act on "LCP went from 2.1 to 3.8 seconds." They will act on "the live blog was slow for 40 minutes at peak, during the hour we had the most readers."
The Google Analytics integration in Niteco Performance Insights helps here, because it puts traffic data next to performance data. You can show when the slowdown happened against when readers arrived, rather than asking leadership to connect two reports themselves.
Use your own incidents
The strongest case is a past event. Take one spike where something went wrong, run it through the cost model above with your real numbers, and present the range. A cautious estimate from your own data carries more weight than a large number from someone else's.
Show the whole estate at once
Groups with many titles often have each brand's team monitoring its own site, or nobody monitoring at all. A single dashboard across every title makes gaps obvious: which editions have no alerts, which templates have drifted, which certificates expire this quarter. Competitive benchmarking can also help frame how your titles load against others in the same market.
Be clear about what you're asking for
Monitoring won't recover lost page views on its own. What it gives you is a faster response: knowing within a minute that a title is down, or within a test run that a new script slowed the article template. Frame the request as reducing the minutes affected in the cost model, because that's the number monitoring can change.
FAQ
What is the difference between synthetic monitoring and real user monitoring?
Synthetic monitoring loads your pages on a schedule under controlled conditions, which gives consistent baselines and fast detection of outages and regressions. Real user monitoring collects data from actual readers' browsers. Niteco Performance Insights is a synthetic monitoring tool and does not offer RUM, so teams that need reader-level data pair it with a RUM tool.
How often should a publisher check whether its sites are up?
During high-traffic periods, every minute is a reasonable interval, and it's the default in Niteco Performance Insights. A shorter gap between checks means a shorter gap between an outage starting and your team knowing about it.
Will monitoring Core Web Vitals improve our search rankings?
Not on its own. Monitoring helps you find and fix slow pages, and faster pages may improve the reader experience. It doesn't guarantee search visibility.
Why test regional editions from their own region?
CDN behavior, ad partners, and consent rules can differ by market, so an edition can be fast from one office and slow for the readers it serves. Testing from the edition's region shows what those readers get.
What should we monitor first if we have many titles?
Start with uptime and SSL on every domain, because those failures affect every reader at once. Then add threshold alerts on your highest-traffic templates, such as live blogs and article pages.