


How to prepare your website’s performance before the big sales season


TL;DR
- Peak-season traffic concentrates revenue into a few evenings, so a slow page or a short outage costs far more in late November than in March.
- The problems that hurt most at peak (heavy campaign scripts, regional storefronts nobody checks, expired certificates) are usually visible weeks in advance to anyone measuring.
- Eight weeks is enough time to set a baseline, fix the biggest issues, and put alerts in place before Black Friday on November 27.
Black Friday falls on November 27 this year, and Cyber Monday on November 30. For most ecommerce teams, the weeks between now and then decide whether the site holds up when traffic is at its highest, and every minute of checkout time is worth the most.
Site performance tends to get treated as an engineering topic. At peak season it becomes a revenue topic, and that makes it a marketing concern too. You own the campaigns, the landing pages, and the targets. You also carry the explanation if the numbers fall short because a storefront was slow or offline.
This post covers:
- What slow pages and downtime can cost during peak season
- Where performance usually breaks for teams running multiple storefronts
- Why one-off speed tests don't give you enough warning
- An 8-week pre-peak checklist
- How to put the business case to leadership
What Slow Pages and Downtime Cost During Peak Season
Revenue per minute at peak
Adobe's data for the 2025 season puts US Cyber Monday online spend at $14.25 billion, with shoppers spending $16 million every minute during the 8 to 10 p.m. peak. Across the five days from Thanksgiving through Cyber Monday, US online spend reached $44.2 billion. (Adobe)
Those are market-wide US figures, and your own curve will look different. The shape usually holds, though. Revenue piles up in a handful of evening windows, so the cost of a problem depends heavily on when it happens. An outage at 3 a.m. in February is an inconvenience. The same outage at 9 p.m. on Black Friday is a line item in the quarterly review.
How speed affects conversion

Speed is harder to see than downtime because the site still works. It just converts less.
- In the Milliseconds Make Millions study by Deloitte and 55, commissioned by Google, a 0.1-second improvement across four mobile speed metrics was associated with an 8.4% increase in retail conversions and 9.2% higher average order value. The study covered 37 brand sites and more than 30 million sessions.
- Portent's analysis of B2C ecommerce sites found pages loading in 1 second converted at 3.05%, against 1.12% at 3 seconds.
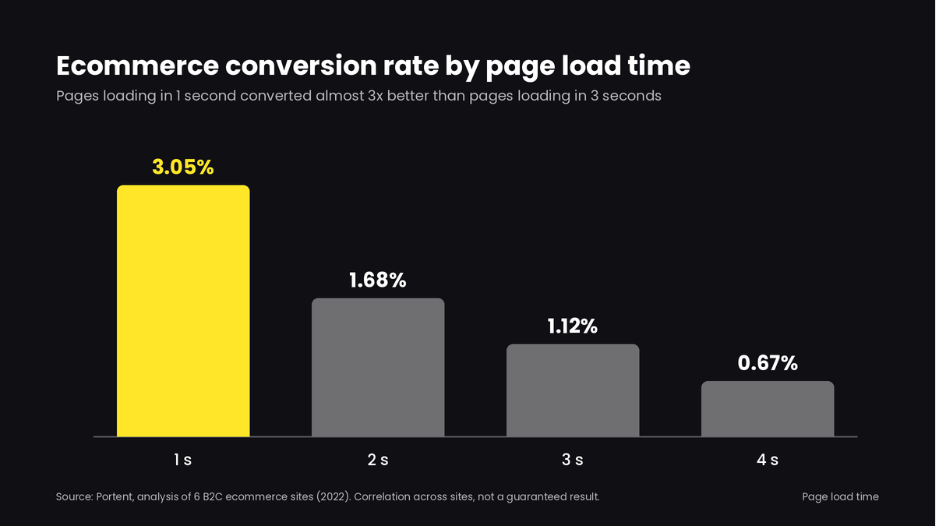
Both studies have limits worth knowing before you quote them internally. The Deloitte data was collected in late 2019, and Portent's ecommerce figures come from six sites. Both show correlation across sites, not a guaranteed result for yours. Treat them as direction, then check the pattern against your own analytics.
A cost model you can run on your own numbers
You don't need an industry benchmark to size the risk. Three inputs from your own reporting are enough:
|
Input |
Where to find it |
Example |
|
Revenue per peak hour |
Last year's Black Friday evening in GA4 |
€30,000 |
|
Minutes of downtime |
Your worst incident last season, or a plausible estimate |
20 minutes |
|
Share of orders lost while slow |
Compare conversion on slow vs. fast sessions in GA4 |
Your own figure |
With those example numbers, a 20-minute outage during the peak hour puts around €10,000 of orders at risk on one storefront. That figure leaves out shoppers who go to a competitor and don't come back, and paid media that keeps spending while the landing page is down. Multiply by the number of storefronts and regions you run, and the case usually makes itself.
Tip: Use last year's hourly revenue for Black Friday and Cyber Monday, not a daily average. The peak hours are the ones you are protecting.
Where Peak-Season Performance Breaks for Multi-Storefront Teams
Most peak-season incidents aren't exotic. They come from ordinary changes stacking up at the busiest time of year.
Campaign assets and third-party scripts
November is when pages get heavier. New hero banners, countdown timers, personalization tags, chat widgets, and affiliate pixels all land in the same few weeks. Each one may be small. Together they can add seconds to Largest Contentful Paint (LCP) on the pages carrying your paid traffic, and often nobody notices until conversion dips.
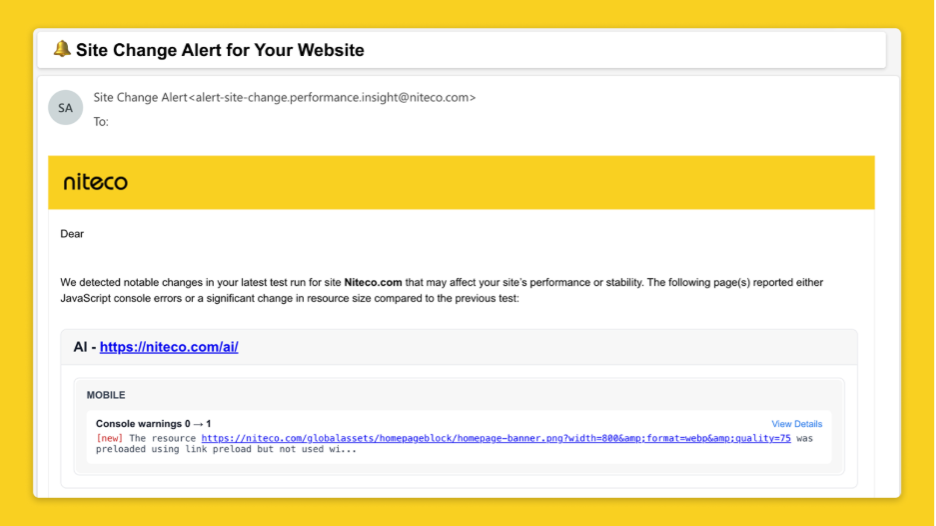
Niteco Performance Insights flags site changes between test runs, including new page resources and new console warnings, so a script added the week before Black Friday shows up as a change rather than a mystery.
Regional storefronts nobody checks from their own market
If your team sits in one country and runs storefronts in six, you mostly see your sites from one place. A CDN misconfiguration or a slow regional origin can leave one market lagging for days while the team's own tests look fine.
Testing from multiple locations closes that gap. Niteco Performance Insights runs tests from 23 locations, so each storefront can be checked from the market it actually serves.
Expired certificates and broken sitemaps
An SSL certificate that expires mid-campaign puts a browser warning in front of every visitor. A sitemap broken by a late content change can slow down indexing of new campaign pages. Neither is hard to fix. Both are easy to miss when attention is on creative and budgets.
Outages found by customers first
The most expensive part of an outage is often the time before anyone on the team knows about it. When the first signal is a customer complaint on social or a drop in the evening sales report, the site may have been down for much of the peak window already.
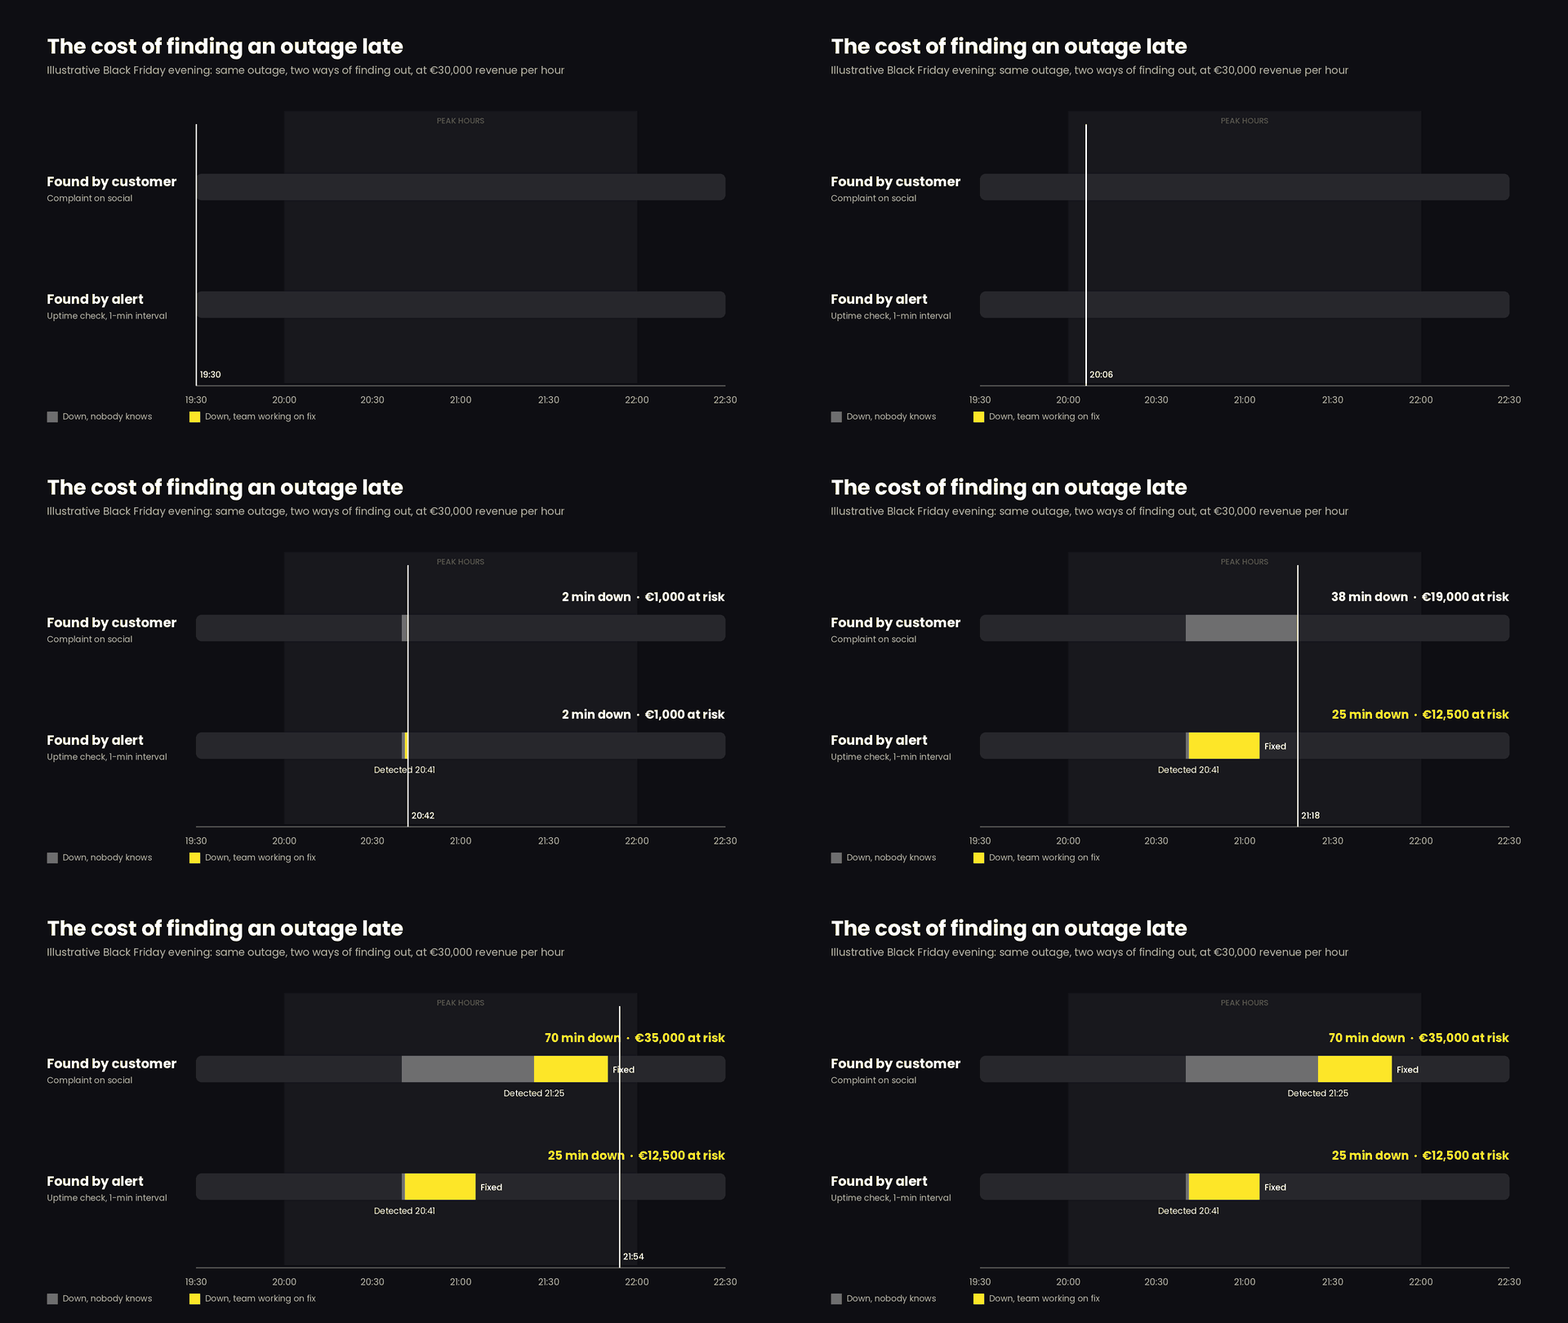
Uptime monitoring shortens that window. It won't prevent an outage, and it won't recover the orders lost while the site was down. What it does is tell the right people within minutes, so the fix starts during the peak hour rather than after it. In Niteco Performance Insights, uptime checks run at a default interval of one minute, with alerts to email, Slack, or Microsoft Teams, plus a recovery notice that includes how long the site was down.
Why One-Off Speed Tests Aren't Enough Before a Sale
Free tools like PageSpeed Insights and Lighthouse are a good place to start. They show what's slowing a page down and how to fix it. Their limit is that they measure one page, once, from one place, when someone remembers to run them.
|
|
One-off lab test |
Scheduled synthetic monitoring |
|
When it runs |
When someone runs it |
On a set schedule |
|
Coverage |
One URL at a time |
Many pages and sites together |
|
Location |
Usually one |
Multiple regions |
|
History |
Snapshot |
Trend over weeks |
|
Alerts |
None |
When thresholds or uptime fail |
|
Best for |
Diagnosing a known page |
Catching regressions before customers do |
Scheduled monitoring is still synthetic, and that is its main limit. The tests run in controlled conditions, not on your shoppers' actual devices and connections. If you need to see how a specific segment of real shoppers experiences the site, you'll need a RUM tool alongside it. For catching regressions, outages, and regional gaps before they reach customers, consistent synthetic tests from fixed conditions are often the more practical signal, because a change in the numbers reflects a change in the site.
An 8-Week Pre-Peak Performance Checklist
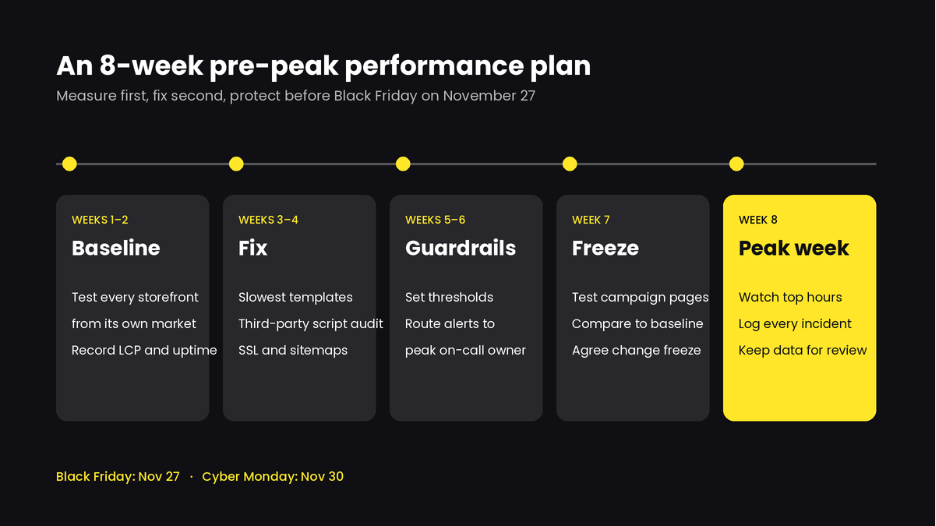
Eight weeks is enough to measure, fix, and protect, but only if the first week goes to measurement rather than fixes.
|
Week |
Focus |
What to do |
|
1–2 |
Baseline |
List every storefront, region, and key template (home, category, product, cart, checkout). Test each from the markets it serves and record LCP, page weight, and uptime. |
|
3–4 |
Fix the biggest gaps |
Work with developers on the two or three slowest templates. Audit third-party scripts and remove anything no longer in use. Check SSL expiry dates and sitemaps across all domains. |
|
5–6 |
Set guardrails |
Set thresholds on the metrics that matter to you. Route uptime alerts to whoever is on call during peak evenings, not only a shared inbox. |
|
7 |
Freeze and verify |
Test every campaign landing page before launch. Compare against the baseline. Agree a change freeze for peak week. |
|
8 |
Peak week |
Watch the dashboard during your top revenue hours. Log every incident with its start time, detection time, and duration for the post-season review. |
A few notes on getting this to work in practice:
- Tie thresholds to the commercial calendar. An alert that matters at 9 p.m. on Black Friday may be noise on a Tuesday in October.
- Agree who gets which alert. Performance threshold alerts can go to the web team, while downtime should reach someone who can act at night.
- Keep the baseline. It becomes your before-and-after evidence in January.
Niteco Performance Insights covers most of this list in one place, with test results, uptime, SSL monitoring, and sitemap checks across every client, site, and region in a single dashboard. The Google Analytics integration also lets you view performance data next to traffic, which helps when explaining a dip to someone outside the web team.
Ready to set your baseline?
Run your first multi-location test across your storefronts with Niteco Performance Insights.
Frequently Asked Questions
How early should ecommerce teams start preparing site performance for Black Friday?
Eight weeks is a practical minimum. It leaves two weeks to measure, four to fix and set alerts, and a buffer before a change freeze in peak week. Starting later still helps, but fixes then compete with campaign launches for developer time.
Which performance metrics matter most for ecommerce conversion?
LCP on product and landing pages is a good starting point, since it reflects how quickly the main content appears. Page weight, uptime, and time to first byte are also worth tracking, especially on templates that carry paid traffic.
Is PageSpeed Insights enough to monitor an ecommerce site?
It works well for diagnosing individual pages. It doesn't run on a schedule, test across regions, keep history, or send alerts, so it can't warn you when something breaks during a sale.
What is the difference between synthetic monitoring and real user monitoring?
Synthetic monitoring runs scripted tests from set locations under controlled conditions, which makes changes easy to spot and compare. Real user monitoring collects data from actual visitors' devices and connections. Many teams use synthetic monitoring for alerts and regression checks and add RUM when they need segment-level detail.
How can marketers make the business case for a website monitoring tool?
Use your own numbers. Take revenue per peak hour, multiply by the minutes of downtime or slow performance you had last season, and compare that to the annual cost of monitoring. Detection time is usually the part monitoring reduces most.